
Resident Survey Ends April 1
Yes The Streets Need Work! But Besides That, What Are Citizens' Priorities?

Every two years, Irving does a survey of residents. You have until the end of the month to take this year’s survey.
It is a long survey. Make sure to finish it! Otherwise your answers will be thrown out. Also, don’t click without looking at the questions: respondents who were identified as taking the survey too fast were removed as well.
The survey is a good opportunity to signify what the priorities of city leadership should be in the next couple years.
In 2024 those priorities were street maintenance (which always comes in #1) at 47%, and homelessness, which came in at a whopping 37%.
There is a dashboard that breaks down survey results from 2024 in different ways. A couple from 2024 caught our eye. (Note that percentages that are reported are the total of “excellent” and “good” ratings added together. )
First is the question, “Being open and transparent to residents.”
Overall, we are right at the regional benchmark. However it’s interesting to view this by age and length of time in Irving:
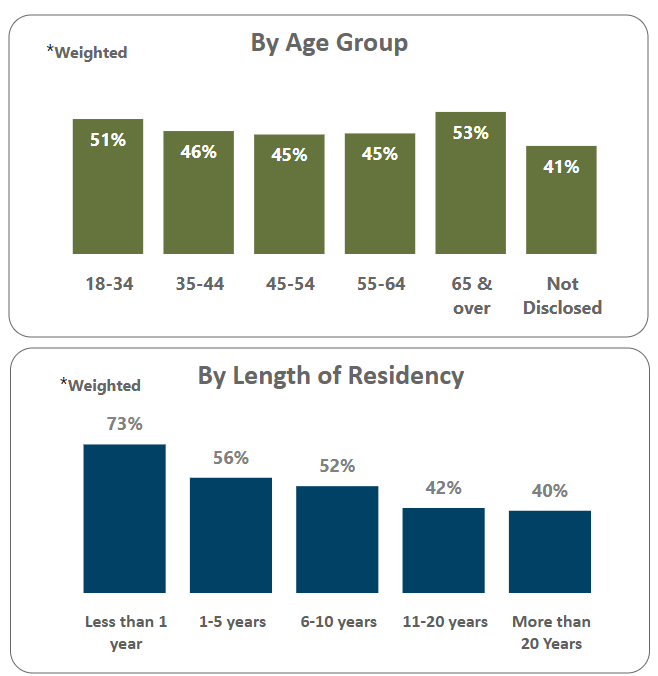
At the top is not a huge difference by age, so it is not a matter of old people being cynical.
The bottom shows a clear pattern. The longer people have been around — and presumably the more they know — the less they rate Irving as open and transparent.
The same thing happens with the question, “Providing residents the opportunity to offer feedback.”
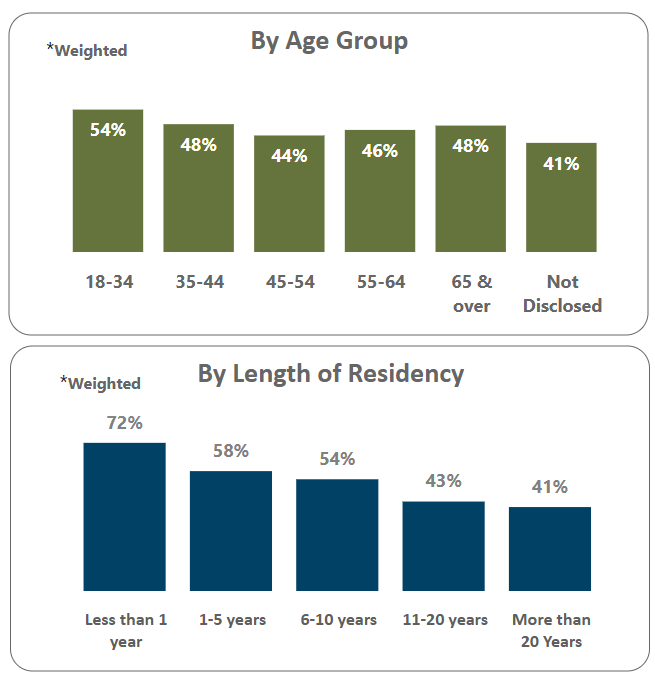
The longer people have been around — and presumably the more they know — the less favorable they are on these two questions.
Any poll or survey is a snapshot in time. Any single given poll is not really meaningful. What is meaningful is the difference between results, as this can tell a story.
Past results are here: https://irvingtx.gov/resident-survey-results.
We put the survey results together since 2010. We included 2024, although actually it should not be included in this table (more on that below).
Here’s the survey results since 2010:
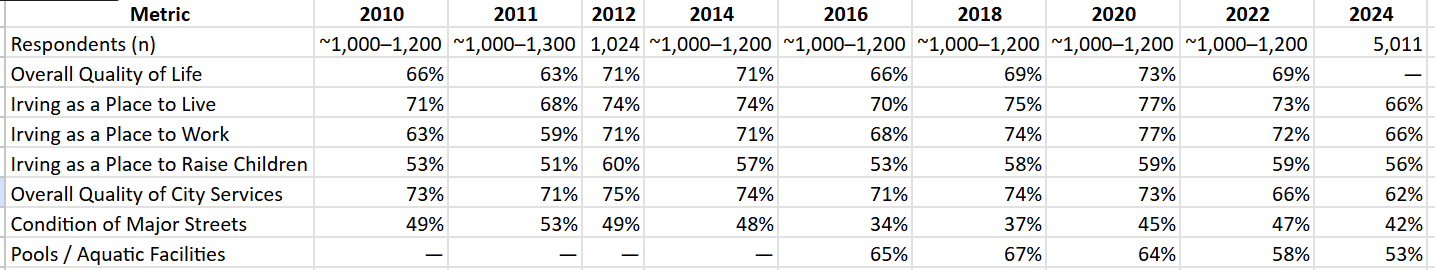
There are a couple stories here.
First, the numbers went up in 2012 (except for streets) and more or less stayed higher than they were.
That probably has something to do with property crime dropping sharply from 2010 to 2012. Irving police focused on the parts of the city with noticeable crime trends, e.g. apartments.
Second, when it comes to streets, the increase comes in 2020. That’s due to the Road to the Future program, which was launched in 2017. It is a long‑term initiative to rehabilitate, reconstruct, and proactively maintain city streets.
The numbers staying higher until 2022 is an achievement. Irving’s population increased from 216,290 in 2010 to 256,684 in 2020, over 18%. To grow so much and to maintain the positive ratings is pretty good.
The numbers drop in 2024. Why is that?
Well, it is an apples-to-oranges comparison, because the methodology changed.
Previously, the survey was not just an open link on the website, but a real random sample. The city drew a ZIP-code-based random sample of households, contacted them mostly by mail and email, and got around 1,000–1,200 completed surveys to represent the whole city.
But in 2024 the city used an outside vendor, Elite Research. On the survey itself, the wording was simplified and open-ended questions were increased. The vendor also used a different, and pretty sophisticated, methodology. They still used a random sample, but in order to get more responses included, they added an open-call component on top, which was promoted throughout the city generally. Then, they weighted the results to match population demographics (ZIP code, age, gender, ethnicity, race, and home ownership) — prior years did not do that.
It worked, and they got 5,011 valid respondents. That is a lot of respondents.
The weighting helps represent underrepresented groups — in the 2022 results Hispanics were underrepresented, for example. Still, since it is not completely a random sample, the 2024 survey does sacrifice statistical purity. The report says the results have a 95% confidence level and a citywide margin of error under 1.4%, however that actually cannot be determined without random sampling.
In sum, there is an argument that the 2024 survey is more representative. But it cannot be compared with previous years to find trends.
Contact: TheIrvingHerald@gmail.com (corrections/comments/news tips welcome)
© 2026 Irving Herald LLC. All rights reserved.
Now extended to April 3.